Posts, Word Count, Rewards, Communities, and other weekly analytical reports - 3rd Week of July
Another week of rewards have been distributed to HIVE authors, and it is time to look, again, in depth at who and what got rewarded, based on word counts, post structure, images, and a number of other bits and pieces. Before I begin with the report, there are some new features I have built into my data set, that enable greater analytical depth.
Whats New since last week?
I have published a post yesterday showing a deeper breakdown in to publishing habits, with insights into how posts on different hive-powered applications tend to have different types of content.
The TLDR of that post is that ecency and peakd are the dominant applications that users choose to create content with.
I have also revised a plot showing the difference in word count and rewards per word count category day on day:
The top of this chart shows the number of posts in each category, represented in the clustered bars. The line tracks the number of unique authors.
The bottom of the chart shows the total payouts assigned to posts published on that day. The line tracks the average net votes on a post.

Anyway, onto the usual reporting:
The third week of July is now over.

For the third week of July, there was $39,590.93 in rewards distributed, compared to $34,222.9 for the prior week. The average payout increased by six cents. The max increased from $87.79 to $118.41. The median was increased by four cents, to 62 cents.
The highest word count was 10,637, 20% shorter than last week, while the average was up to 444 words, from 436, and the median increased from 268 to 273.
The overall trend of shorter posts being the more dominant on the platform continued, with even less posts (35%) being longer than average.

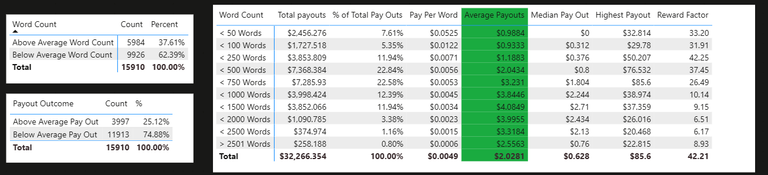
8.2 million words were published in total on HIVE for the period, and here is the distribution

Pay per word was about the same since the last set of data was imported, and the majority of the payouts went to posts under 750 words (same as last week). Average payouts to shorter posts increased (again), but payouts were up across the board, seems like there was a little more in the reward pool.

What about the typical post on HIVE? What does that look like? Well, thankfully, here's some stats - this week with some new data points, average replies!
Posts got slightly longer, included more pictures. Engagement was slightly down.
This Week

Last Week
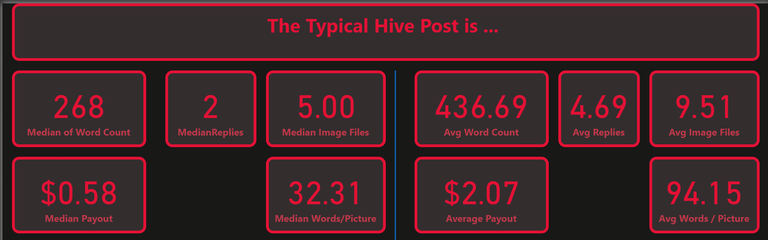
It will be interesting to see how replies change over time.
There still isn't much difference between the median and average post, other than the fact that there's significantly more words in the average, and a few more pictures.
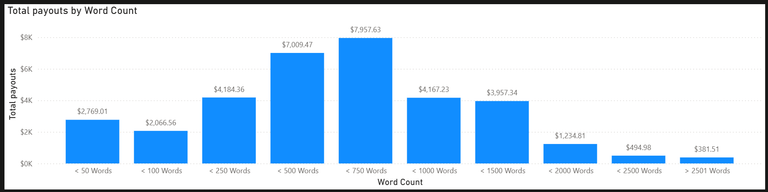
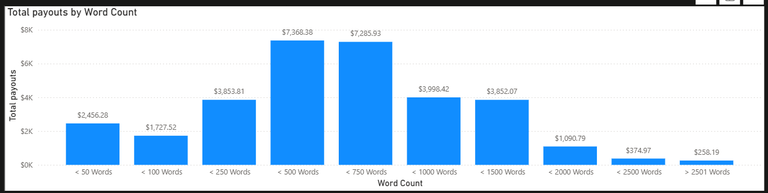
How does total, aggregated payout look, compared to the word count? A little bit like the distribution of the posts, it seems, with a steep falloff for longer posts.
Shorter posts continued to get "more" rewards proportionately. A good uptick in the 501-750 words category, and a reduction in rewards for longer posts under 2000 words seemed to continue, as a percentage of the total.
This Week

Last Week
Three Weeks Ago
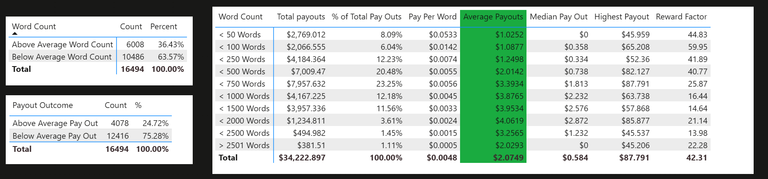
How about when we consider a few more variables, and look at the reward factor? That is to say, the highest payout in a word count group divided by the average?
The reward factor grew by 13. That means the highest rewarded posts are taking 55x more than the average payout across all the word count categories.
This Week

Last Week
Three Weeks Ago
Moving On
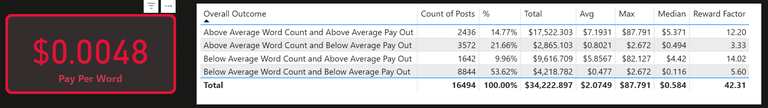
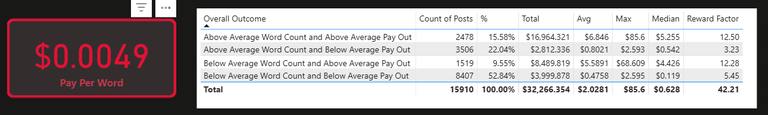
14.82% of all posts published on Hive were above average word count and above average pay out. 10.13% were below average word count, and above average payout. There is room for awards to be allocated by curators to those appearing in the above average word count and below average payout category. There's ~$15k of awards allocated to shorter posts.
There reward factor for "below average word count and above average pay out" grew sharply. Again, that's max payout divided by average, presented as a number.
This Week

Last Week
Three Weeks Ago
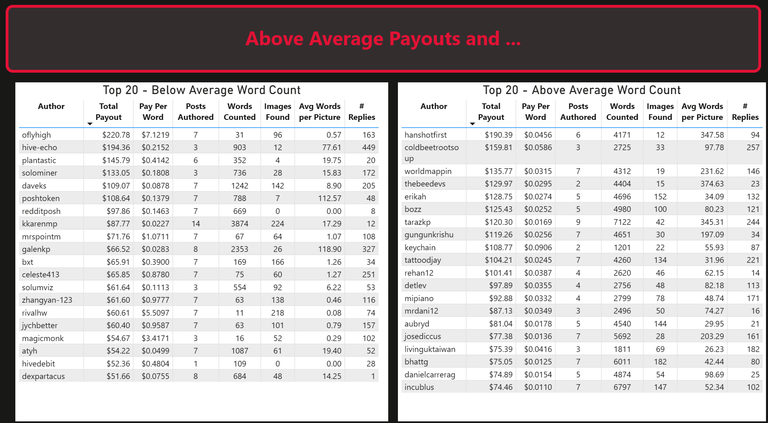
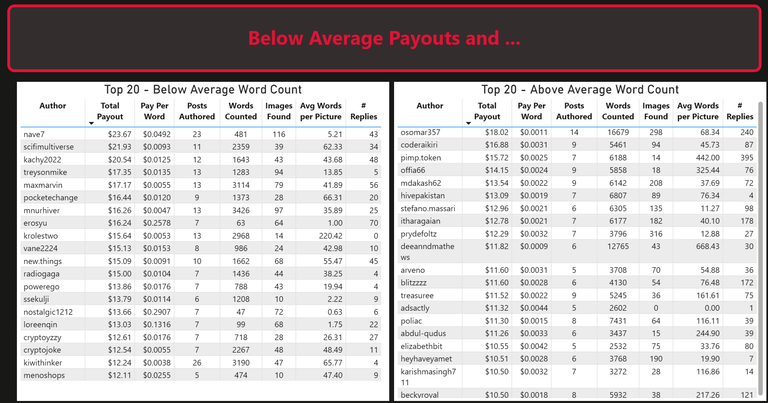
What about when we look at authors on an individual basis, for the period? (Or at least the top 20 for each category?
This Week

Last Week
Three Weeks Ago
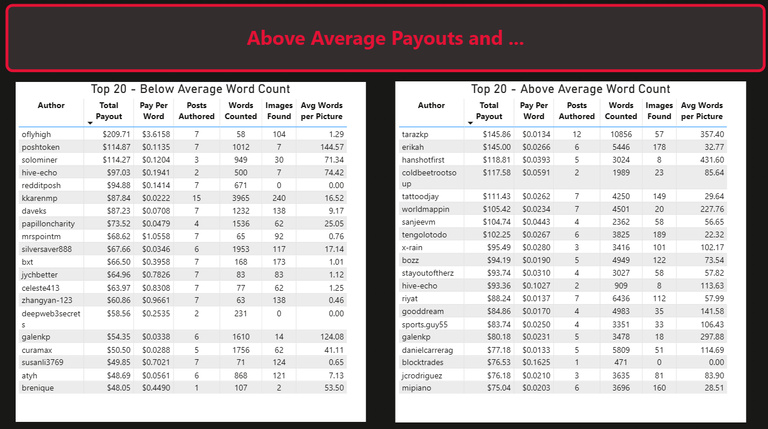
I have added engagement, by measure of total number of replies to an author's top level posts here. I am curious as to the range of comments received by authors in these categories. There's a wide variation in the engagement each author gets for their rewards, regardless of their word count.
The same authors tend to appear in the lists, week on week. They're consistent and persistent.
What about those potentially "emerging" authors, with Below Average payouts?
This Week

Last Week
Three Weeks Ago
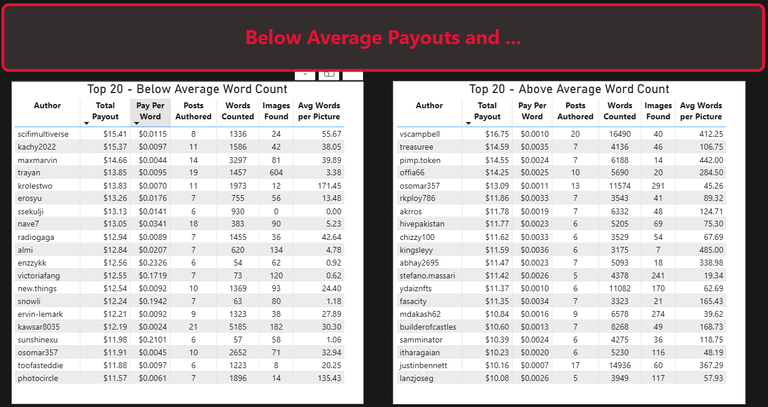
Different authors are appearing in these, but there are a number of curation / token projects appearing in below average payout and above average word count week on week.
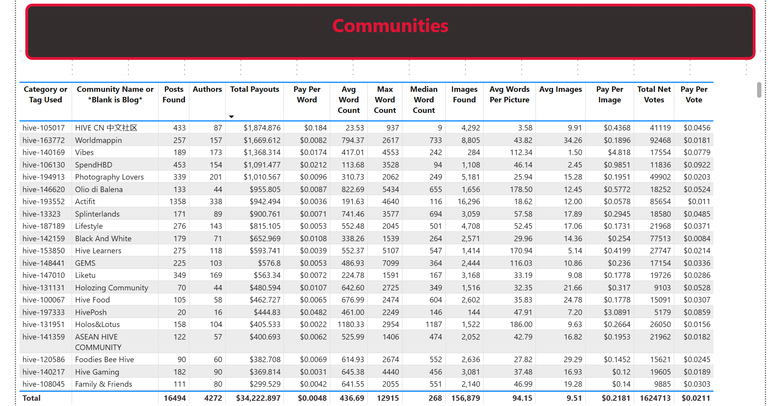
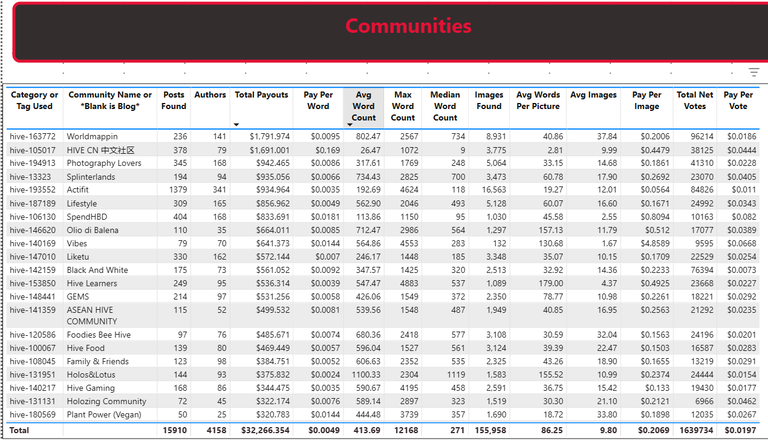
Finally, I have put together a view of the key metrics I'm looking into for this data set into a slice by community, sorted by total payouts.
I've reordered some of the columns in the data for better readability. HIVE CN took the most rewards. Vibes is a growing community, and Worldmappin and Photography Lovers remain quite close to the top. Spend HBD had a little less volume again this week.
This Week

Last Week
Three Weeks Ago
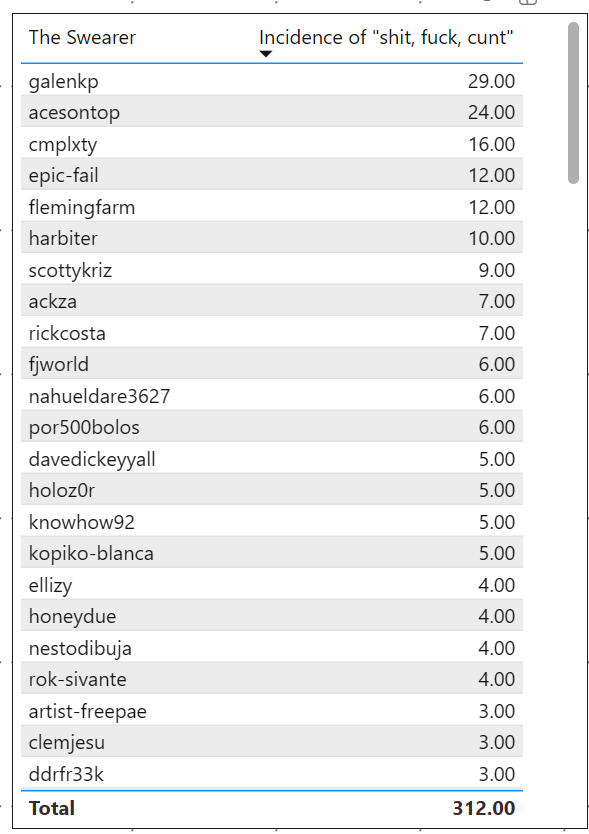
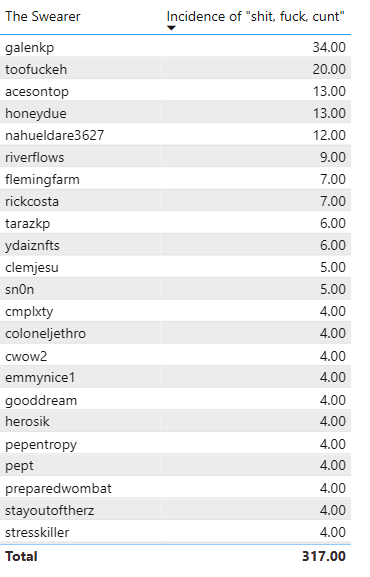
Who the fuck swears the most in their posts on HIVE? (Not comments, just posts!)
The only words, as an Aussie, that I consider swearing are "shit", "fuck", "cunt" (or variations thereof, so this captures "fucker", "fuckhead", "motherfucker", "shithead", etc
Step aside, @galenkp, you no longer swear the most. @nahueldare3627 takes the swear jar all to themselves, just beating out a few other users.
This Week

Last Week:
Three Weeks Ago:
Thanks for taking a look at the data. I'm still keen to get more ideas from you all on how this can be improved for future iterations and hope you enjoyed the new features, or whatever other metrics I might be able to extract.
Well ain't that a bitch?! I have to admit I both admire and get a little intimidated by these charts and all the work you've put in here. It's strange, cause I consider myself pretty good at reading them, but my dyslexia is totally winning tonight.
Please forgive me if I sound patronizing or like a total idiot, but I think what is missing for me is:
I know I'm asking you to dumb it down, but I sincerely want to know how to apply this data to improve posts, work-payout gap, engagement, etc.
The chart that broke my brain was the first one 😆. It has so many variables that I don't know what to take out of it... it kinda seems like there is a negative correlation between the Volume of Posts and the sheer Payouts... am I right?
While you're providing the 'is', I'm sincerely (though fallaciously) trying the derive the 'aught'.
Overall hypothesis: for posts that are mostly text (ie, rely on a long word count, and from a perspective of writing) - take more effort - why do curators favour voting on shorter posts?
The data is post data, split up by word count, and a few other measures. (How many pictures does it have, etc)
The questions I continue to ask by presenting this data - why do curators constantly reward shorter posts?
Are authors complacent and unwilling to increase their quality?
Why do some posts with below average word count get above average payouts?
It is all questions I am hoping thay curators can ask themselves when voting on posts to ensure those that pit genuine effort into longer form content are rewarded for that effort.
Conclusion: Nothing has really changed after three weeks of presenting this data.
Thank you for breaking it down!
Maybe curators are being too busy or lazy to read longer posts?
If I was a serious curator I would devise a bot that would hunt for posts over a certain number of words, and only review those for curation.
Yes, that would only apply it if I'm a 'writers' curator.
I can (and will) break down this data by community. There is a big difference between the types of posts in day Photography Lovers than when compared to something like The Ink Well, or Alient Art HIVE, or Movies and TV.
Each community has its types of content, but similar communities (you would think) should receive rewards that are good, and rewards that are not as good, based on the measure of quality in that given community.
Content is hard to review using measures and metrics, and word count and the number of images in a post are just one way of reviewing that.
Just as not every story is written is "good", not every photograph posted can have that label either.
It requires personal responsibility to assess each post on its merits. To me, those merits are length and intent.
To the data, this does not appear to be the case.
I want people to put more effort in for their content, for their readers.
People shouldn't be getting 40 or 50 hive for saying that they powered up, or asking a fifteen word question.
That's my opinion, but just like assholes, we've all got one:)
Length and intent seem like a fair starting criteria.
To see authors think outside the box, we have to start by defining it. So I think having some set rules is a good place to build from... of course while keeping in mind a healthy threshold for the rule-breakers.
Yes. I don't want to see someone stretch out a story or a review of something to 1000 words just because of some vague criteria. Sometimes, you can say the same thing in 200 words.
Going from that 1000 words to 200 words is what takes some real skill, though.
At the same time, 20 progress pictures of an artwork is a lot of effort. A description of each step is even more effort. A video documenting the drawing with verbal commentary about thinking about the work as its being made is probably more insightful, again.
But at the end of the day, the artwork is the output - it is what people will put on their walls or go see at a gallery. The journey of that creation is usually for the creator, and it is good to see it documented.
My view is that there is no alternative for looking at the content itself, and being able to see "through the bullshit" that some people hide behind in the creation of their posts, like, for example; over complicating the process, or making it appear to be very complicated and require a lot of skill, when, in reality, sitting down with someone for 20-40 minutes would get someone with no skill to have significantly more skill in that field.
I am aware of the fact, that with this response, I am rambling, and probably going into much detail, and possibly losing focus of what I was trying to say, but data is data, and content should make us feel something, we should connect with it.
Sometimes we do that if its longer, sometimes we do that if it is shorter, but the trend on HIVE, I think is that the combination of laziness and persistence is rewarded over ambition and persistence.
Uff as an illustrator I'm certainly guilty of presenting artwork this way... I guess we're all just trying to be seen here and evolve with whatever format seems to be working while discarding the ones that actually make sense.
Do you use traditional media or digitally illustrate?
I know that (I can't remember the name of the app on iPad) has a "video output" feature that shows the development of the work from the blank canvas to the point you output it, and its very interesting, but I am certainly no illustrator - but I did go to art school.
What I learned there is that everyone's practice is entirely different and unique to themselves, and they do it for different reasons, and present it in different ways, too!
That is what makes us all so darn interesting!
These days, most of my artwork is digital. I do a lot of vector designs and occasionally I also do digital painting. So much of my work is spontaneous, where I cant really tell you if I even have 'a technique' (if that makes sense).
So long as it is done for you! :) That's the most important thing.
If I was a curator that saw the data you put out, I would totally ask you to devise some sort of curation optimizing bot, that would sorts word count, pictures no (because even some dividers are pictures). The rest would be up toe the curator and their team to determine what's good.
Nothing compares to looking at the content with one's own eyeballs.
A tool could be built, for sure, but thay is (for the time being) beyond my level of technical proficiency.
Ultimately "grading" every post isn't the objective, because every post deserves to stand on its own, regardless of an authors history.
I am often guilty of going into too much detail, just like with this post. I go into too much detail, because I care deeply and passionately about producing the best possible quality of something, whether Im writing a review doing some analysis, taking photos, or writing a story.
Even when responding to posts, I try to be as deep and as detailed as possible.
So many people disregard detail, and as a result, miss out on so much. It is clear by you questioning that you are interested in that detail, and Im grateful for it and for the challenge of really thinking about what I am trying to achieve by presenting this data.
Just the fact the you were able to extract all this date is already impressive. So I'm certainly not trying to add more on your plate to build more stuff on to of that... fully being aware that the factors that play into this are virtually endless - cause we're talking about quantifying subjectivity, hehe.
But yes I'm definitely following this develepment, and also love the extra data with the swear words! that was totally out of the blue, now we need to know what was the payout for each 😜
Btw a bit random but would you be interested in running some data analytics in a manual curation and engagement contest I'd wanna continue? It'd help carving out new participants and winners along with gamifying current winners and their future delegation rewards/other.
I'd pay in beneficiaries xD
I might be able to help - after all, I have no job at the moment. Feel free to message me details on discord, same user name as here.
I have had an idea in conversation with @dalz to see if it is possible to see which accounts have given posting authority to the auto voter services, - and if that's possible, we might have the ability to know who "for certain" doesn't use an auto vote service.
It won't stop those who run their own scripts on their own hardware / infrastructure to do autovoting from being included, but it would probably exclude a big chunk of "voting" accounts as a data point.